BRAND STORY
How Fresh Clean Threads proved the TUFF Tee is actually cleaner
by
Shanley Knox Harruthoonyan
The ABLE team is on a call with a partner presenting a garment life cycle assessment.
You’ve probably had this happen at your company: marketing, sustainability and product folks get in a room around a sustainability result or report, and the first question after the presentation is - “what does it mean?”
This kind of conversation can be frustrating. As marketers and product leaders, we’re looking for simple answers. And, most often, the answer in sustainability terms is - “it’s subjective.” How much water you use might be low for the specific crop you’re sourcing, but high for another. Your carbon use might be high as compared to average industry, but lower than last year’s benchmarked against your own operations. So, how do we make these numbers actually useful for the business?
One way is to create clear marketing language that brings these numbers to life in a context a consumer can understand.
Another path forward is through a comparative life cycle assessment.
This is exactly the brief that our partner ColorSorts gave ABLE for their client Fresh Clean Threads. Founded in 2015 by Matthew and Melissa Parvis, Fresh Clean Threads began as a side-gig operating out of their guest bedroom in Pacific Beach, San Diego. In the years since, the two have built a brand rooted in a love of the ocean, and trusted for its dedication to a clean supply chain.
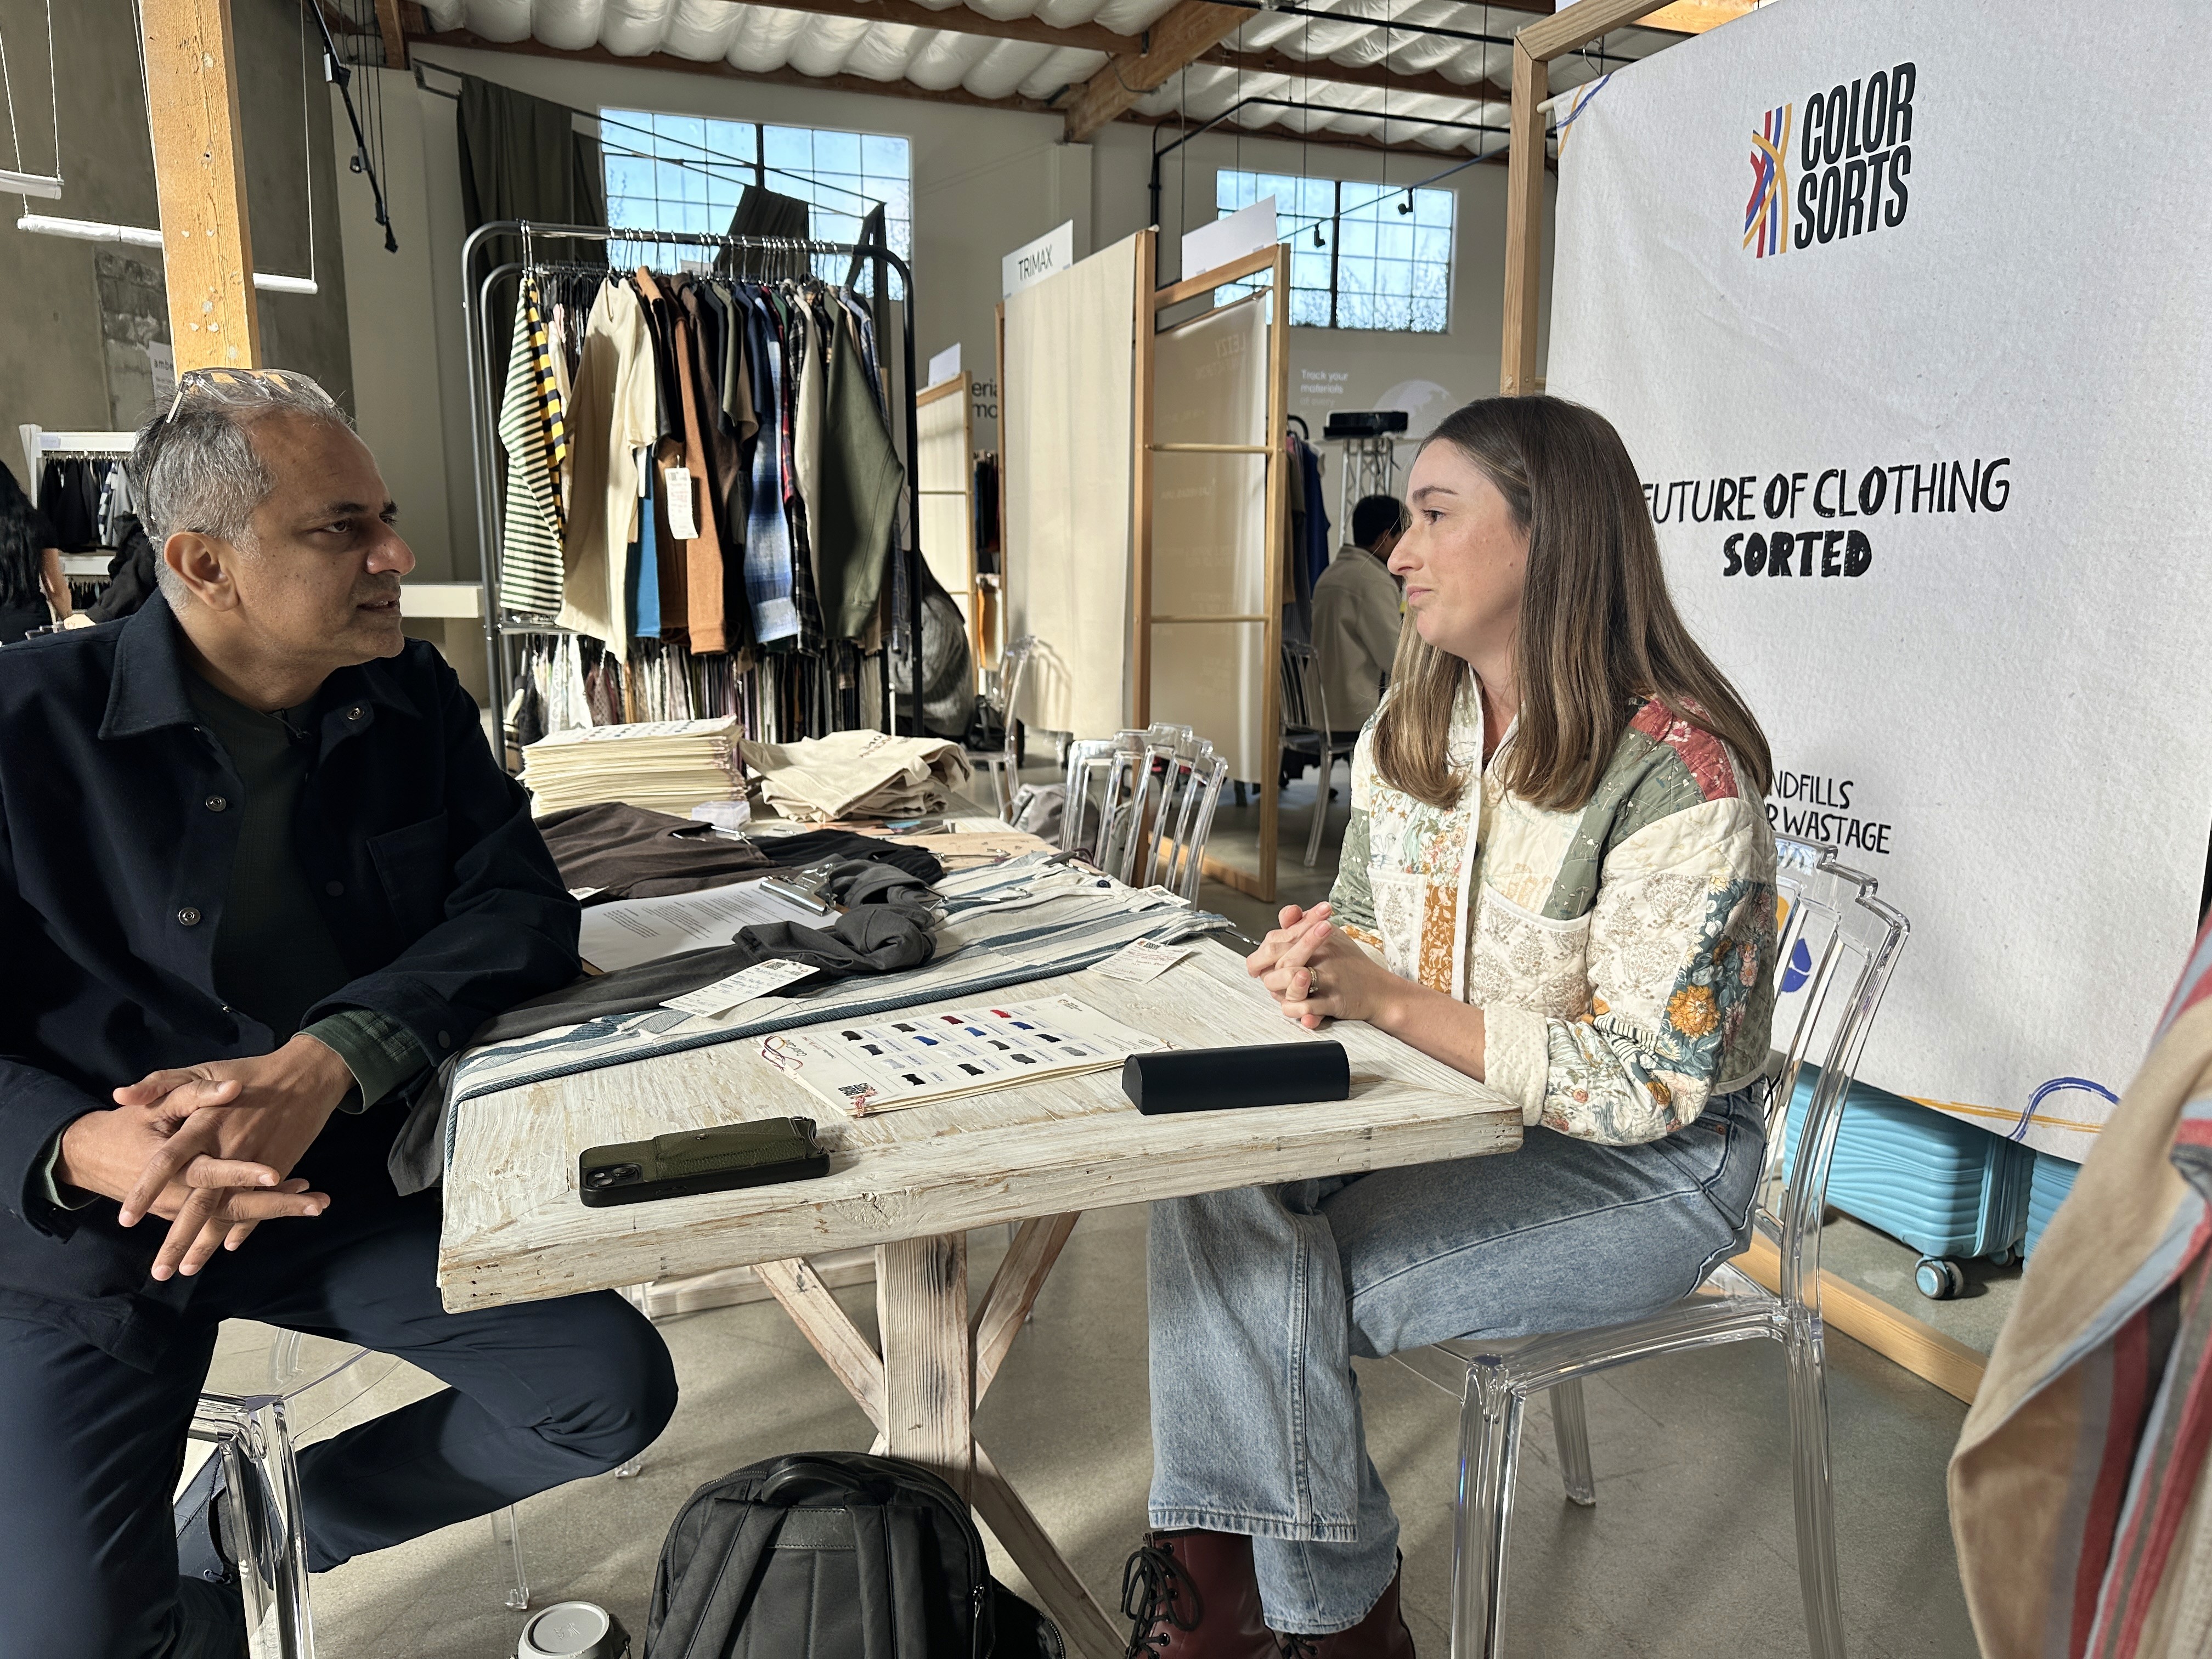
Our challenge: to work with India and NYC based company ColorSorts to define just how clean Fresh Clean Threads is compared to others - starting with their popular product the Tuff Tee.
In this blog, we’ll break down exactly how we got there, because before we can figure out if we’re better at all, let alone by how much, we have leg work to do.
Step 1. Building Our Point of Comparison
Before we calculate anything, we have to decide what we’re calculating against. A number in isolation can't be "better,” right? It can only be lower, higher, or different from something else.
That "something else" is usually one of three things: a competitor's product, an industry or market average, or your own prior version. Which one to use is about what’s right for your sustainability and marketing goals, your customer and your sourcing partners.
Beating a competitor tells a sales story. Beating a market average tells an industry story. Beating your own baseline tells a progress story.
For the TUFF Tee, we built two points of comparisons:
"Did switching to recycled materials actually make a difference?" We held everything else the same — same garment, same construction — and changed one thing: the fiber.
"How does this stack up against a typical cotton t-shirt someone would already buy?" This is a question a shopper — or a journalist — might ask. It's a broader comparison. But it helps answer, “is it better than average?”
2. Setting the Boundary
A “system boundary” is a life cycle assessment term that literally just means the point where you start counting and the point where you stop.
The three most common: cradle-to-gate (raw material through the factory door), cradle-to-grave (all the way through consumer use and disposal), or a modular breakdown that isolates specific stages. None of these is more "correct" than the others. What matters is that you pick one, state it plainly, and that it works for the specific outcome you’re looking to communicate.
We chose cradle-to-gate for the TUFF Tee: raw material extraction and fiber production, spinning, knitting, wet processing and finishing, garment assembly, and the transport between those stages — stopping at the factory gate. We chose that boundary because it's where ColorSorts has primary data and direct influence.
3. Getting the Makeup Right (Apples to Apples)
It might be helpful to think of a comparative LCA a little bit like a science experiment. We have to set variables in order to know if the two processes we’re comparing are different.
That means matching the functional unit (the same basic product, expressed in the same units) and, as much as possible, holding the product's construction constant so the comparison tests one variable at a time. For the TUFF Tee, the functional unit was one t-shirt at 0.334 kg. The conventional tee we compared was modeled from ColorSorts' own production specs, built the same way as the TUFF Tee, with virgin cotton and virgin polyester in place of the recycled cotton and recycled polyester the TUFF Tee uses.
The market-average comparator worked a bit differently: it’s a 100% conventional cotton t-shirt, scaled from peer-reviewed literature to the same 0.334 kg functional unit — useful for showing where the TUFF Tee lands relative to the wider market, but built from different source data, at a different level of certainty, and flagged in the report as an indicative upper bound rather than a precise gate-level figure.
4. Impact Assessment: Turning Materials Into Numbers
As a last step, every process gets converted into a number. A kilogram of fabric, a liter of water, an hour spent dyeing — each one gets run through a known conversion rate that tells you how much environmental impact that specific thing causes. Think of it like a currency exchange rate, but for pollution instead of money: it turns "this much diesel burned" into "this much carbon released."
The ABLE platform runs that conversion across 16 categories, covering impacts to air, water, and soil. For the TUFF Tee, we filled in those numbers using two sources:
Primary data — twelve months of 2025 utility bills, production records, chemical recipes, SDS sheets, and diesel receipts from five suppliers — covered the stages ColorSorts could measure directly. Where primary data wasn't available, we used ecoinvent EF v3.1 industry-average datasets to fill the gap.
Every material and process, from both sources, was then characterized against four indicators: climate change (kg CO2e), water use (litres), eutrophication (kg PO4-equivalent), and ecotoxicity (CTUe) — the same four indicators applied identically to the TUFF Tee, the conventional comparator, and the market-average benchmark.
What We Delivered
Three things came out of this work for ColorSorts and Fresh Clean Threads.
The first was the comparative LCA itself — cradle-to-gate, built to ISO 14040/14044 principles and PEF/PEFCR-aligned, run across four indicators against two comparators. Twelve months of 2025 data from five suppliers, filled in with ecoinvent EF v3.1 wherever direct data wasn't available. The result: the TUFF Tee came out as the lowest-impact option on every single indicator we measured, against both the conventional comparator and the market average.
The second was a visual transparency story — a passport for the TUFF Tee that traces it stage by stage: rPET recycling at Ganesha Ecosphere in Faridabad, shredding and spinning at Usha Yarns in Chandigarh, then knitting, washing, compacting, and final assembly, all within Tamil Nadu.
The third was a marketing claims book — the language Fresh Clean Threads can use today, and just as importantly, the language they can't use yet. In it, every claim is tied to a specific number, a specific comparator, and a specific boundary: "51% lower carbon footprint than a conventional t-shirt, cradle-to-gate," not just "lower carbon." And, finally, what's off the table — broad terms that would flag a company for greenwashing like "green” or "eco-friendly.”
Suppliers around the world use ABLE to share their primary data.